
 Go Back


Despite organising the ground level work as perfectly as possible, most bus operators are facing problems in balancing profitability and occupancy ratio. To grow your business, it’s not wise to just take decisions based on speculation. We must make our business decisions by analysing the factual data reports. And these data are readily available for the bus operators on their system under the “Occupancy Forecast Report”
It is used to get a detailed report on the occupancy ratio at each route level. This helps to identify the routes with higher/lower demand, the departure time that is preferred mostly by the passengers for a particular route, occupancy based on the hubs, etc.
With advanced reporting, you can easily optimise your occupancy patterns and have high revenue as much as feasible. Now, let’s take a look at how the Occupancy Forecast Report can help you increase your profitability by increasing the occupancy ratio and reducing the average cost per seat.
Your worst nightmare as a bus operator is seeing your buses running at lower occupancy. To avoid this situation and to plan better, we need a productive business system, and that is – “Occupancy forecast report”. The data obtained by the report helps you to streamline your bus operations to increase occupancy, maximise revenue potential.
Let’s take a look at how the Occupancy Forecast Report can be used to increase your profits by getting higher occupancy and lowering the cost per seat.
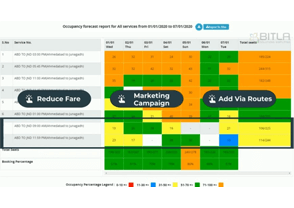
When sorted as per “city pair” and the “date range” filter is applied, distinct occupancy trends are observed in the report. There you can locate the routes with the highest and the lowest peak of demand and increase or decrease the number of buses accordingly and divert a few services from the routes with lower occupancy.
You need to sort it further using “Occupancy Percentage”. This assists in identifying the routes with the least occupancy rate. To market these routes, you can reduce the seat fare, run “marketing campaigns”, add a few via routes, and so on.
To identify the routes where you need to add or remove services running at a specific time, you can further sort the report based on departure time as well.
The report can also be grouped as per the hubs. Based on the occupancy trend data available, you can manage the services for specific hubs.
Using these filters and sorting orders on the report makes it easier for you to make business decisions that can result in an overall increase in the occupancy rate.
By hovering the mouse on each schedule, you can look into the sources of bookings. As you know, the more e-bookings you get on your website, the lesser you pay commissions on other sources of the bookings, which mean higher profit margins. Accordingly, you can design your marketing campaigns to promote more e-bookings on the other routes as well and reduce its cost per seat.
Increasing the occupancy rate and reducing the cost per seat will help you realise higher profits from your business. Furthermore, the filter and sorting order options available on the report makes it easy for you to read and get the data as per your need.
To know more about the Occupancy Forecast Report and other features on the system, please contact our support team, your click here.